
Realtime temperature sensing is one of the common requirement. There are a lot of digital thermometers and temperature monitoring devices available in online shopping sites. But most of them just monitors and displays the realtime values. It does not have any intelligence. The one we are going to build is a smart temperature monitoring system. This system can be used for monitoring atmospheric temperature as well as liquid temperature.
The following blog post explains the set up of a digital temperature monitoring system.
Digital Temperature Monitoring System
We will enhance the above system by adding analytical capability. So that we can analyse and show the temperature trends. The block diagram below shows the high level architecture of the system.
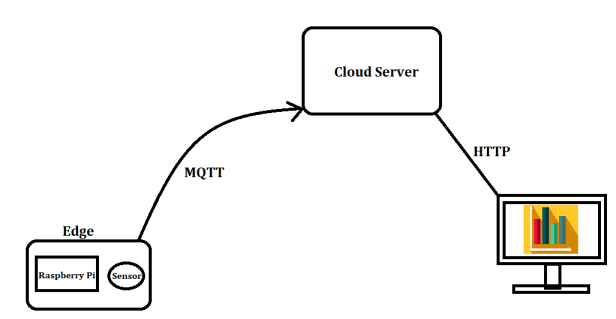
As shown in the above diagram, the system has three blocks.
- Edge Device & Sensor (Raspberry Pi & Sensor)
- Data Storage Server
- Dashboards for the end user
The following are the software components required for this project
- MQTT for sending the data from the edge to the server.
- PostgreSQL for storing the data in the server.
- Python based backend
- HTML Web UI
I am not going to explain the working of MQTT in this blog post. This was already explained in one of my earlier posts.
Before we start implementing the solution, lets summarize the story line.
- The requirement is to perform realtime temperature monitoring and analyse the trends & patterns using the historic data.
- A temperature sensor is attached to a Raspberry Pi which acts as the edge device.
- Need provision to support multiple edge devices.
- Capability to monitor the temperature from anywhere
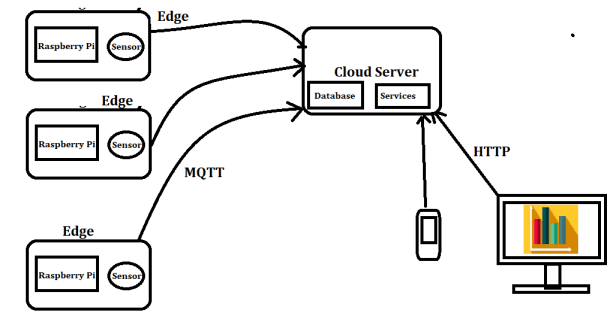
Bird’s eye view of the system
Here we have considered multiple edge devices and also considered the provision of web and mobile application.
Data Model Design
In the PostgreSQL database, we need two base tables for storing the data. We will be able to store data from multiple edge devices located at different locations using this data model. This is a very basic data model. We can enhance this based on our requirement.
- device_info – This has the metadata of the edge devices. This includes the location details of the device. The column names are given below
- device_id, device_name, location
- temperature_data – We store the temperature data from each of the edge devices in this tables. The column names are given below.
- device_id, timestamp, value
Now let us start developing the application from the edge device. We will modify the program to send the messages to an MQTT topic with the timestamp. The temperature readings will be sent to the server once in every minute. The message format will be as follows. We will be using epoch timestamp in seconds and temperature in Degree Celsius.
{"device_id":"xxx", "timestamp":1584284353, "value": 27.01}
Now lets develop a small python program that send this values to the MQTT topic. For this, we need an MQTT broker to be up and accessible from the Raspberry Pi
Here my central server is a CentOS 7 server and I will be using mosquitto MQTT. The installation steps are explained very detailed in this blog post.
In the central server, these messages will be collected and stored in the database tables.
A sample view of the temperature_data table is shown below.
| device_id | timestamp | value |
| device_01 | 1587825234 | 27 |
| device_02 | 1587825234 | 28 |
| device_03 | 1587825234 | 23 |
| device_04 | 1587825234 | 28 |
| device_05 | 1587825234 | 30 |
| device_06 | 1587825234 | 26 |
| device_07 | 1587825234 | 22 |
| device_08 | 1587825234 | 28 |
| device_09 | 1587825234 | 32 |
| device_10 | 1587825234 | 29 |
| device_11 | 1587825234 | 31 |
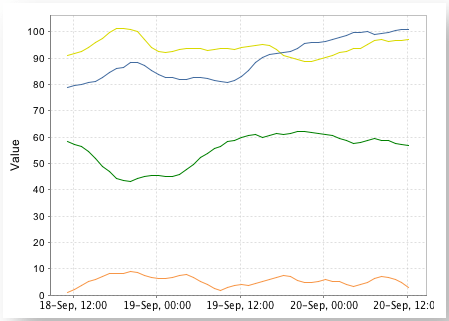
Now from this table, we can query and get the required information based on the user requirement. We can either develop custom visualization using javascript or we can query the DB using workbenches or we can even connect & visualize data using visualization tools like Apache Superset, PowerBI etc.
With this I have explained the highlevel architecture and implementation of a sample IoT system. This system can be scaled further by using a proper time series database instead of the Postgres DB.
